
'Code red' according to market indicator with a 150-year track record
- Jul 22, 2025
- 3 min read
Updated: Aug 1, 2025

Even in times of economic prosperity, current stock prices would be considered high.
One of Wall Street's most reliable indicators is flashing “code red.” According to this proven valuation tool, we are in one of the most expensive stock markets since 1871, and a decline is inevitable. The Motley Fool explains.
The stock market has had a tumultuous year with exceptional fluctuations. In early April 2025, the S&P 500 and the Dow Jones suffered losses that rank among the top five sharpest declines ever. This was followed shortly thereafter by a spectacular recovery. Within a few days, the major stock market indices went from correction territory to record highs.
This sharp turnaround seems to confirm optimism, but the Shiller P/E ratio of the S&P 500, also known as the cyclically adjusted P/E ratio or CAPE ratio, warns of serious risks.

The Shiller P/E ratio is a modified version of the traditional price-earnings ratio. Whereas the standard P/E ratio looks at earnings over the past 12 months, the Shiller P/E ratio uses the average of real (inflation-adjusted) earnings over the past ten years. This makes it a more reliable measure for assessing long-term valuations, especially in cyclically sensitive markets.
Flawless pattern
Of course, no indicator can predict the future with certainty. But this measure has a 100% success rate in predicting the direction of the stock market over a period of more than 150 years.
On July 10, 2025, the S&P 500 closed at a new record high, with a Shiller P/E ratio of 38.26. That level is close to previous peaks in market valuation, such as during the dot-com bubble and in early 2022. At this level, the market is on the verge of reaching the third-highest valuation in more than 150 years of stock market history.
There have only been six periods in which the Shiller P/E ratio exceeded 30 and remained at that level for at least two months. In all five previous cases, this was ultimately followed by a sharp decline of 20% to as much as 89% in major stock indices such as the Dow Jones, S&P 500, and Nasdaq. The current situation could lead to a correction in the stock markets, as valuations are unsustainably high.
Although the Shiller ratio is not an exact timing tool – sometimes the market declines rapidly after reaching high valuations, sometimes only years later – the pattern of overvaluation followed by sharp declines is consistent. The value of this indicator lies in signaling unsustainable valuations that will eventually lead to a correction, not in predicting the exact moment when this will happen.
Every cloud has a silver lining – even a market correction
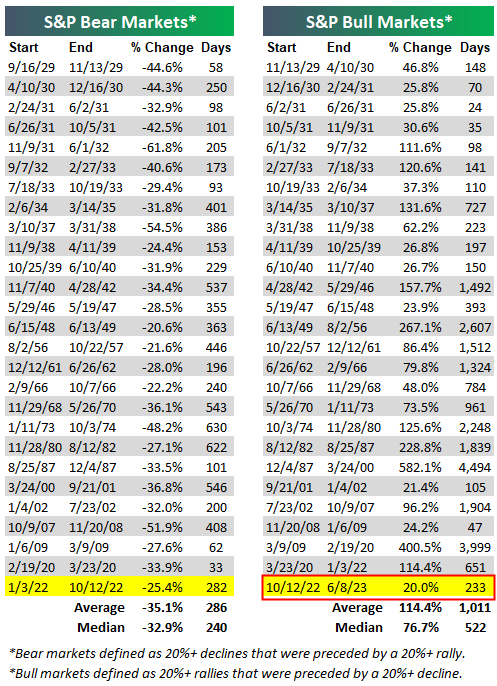
At the same time, this warning offers a valuable perspective. Corrections and bear markets are inevitable, but historically relatively short-lived. Data from Bespoke Investment Group shows that bear markets in the S&P 500 last an average of 286 days, with none lasting longer than 630 days. In contrast, bull markets last an average of 1,011 days – almost four times as long.
The current bull market began in October 2022. If the trend of previous markets continues, it is likely that the rise will continue for some time, even if there are interim corrections. In that light, sharp corrections should not be a cause for panic, but rather opportunities to buy at lower prices.
Long-term investing pays off
History shows that despite temporary declines, the stock market rises over the long term. Those who do not give in to panic and instead take advantage of market weakness can benefit in the long run. If the Shiller P/E proves correct again and the market soon begins to decline, this will offer investors the opportunity to pick up quality stocks or index funds (ETFs) at a more favorable price.
More than a century of stock market history supports the idea that strategic and patient investing pays off. For investors with staying power, such periods can lay the foundation for future returns.
Sources: The Motley Fool, YCharts, belegger.nl, Arthur Mazi, Bespoke Invest


Comments